New Study Shows Rates Escalating Among Poor but Declining for Wealthy Whites in California
SafeMinds Interviews Lead Author to Gain Insight
A startling new study out of the University of Colorado Boulder exposed an unexpected trend. Autism rates are escalating for African American and Hispanic families as well as economically disadvantaged families, while the rates for wealthy Caucasian families have declined.
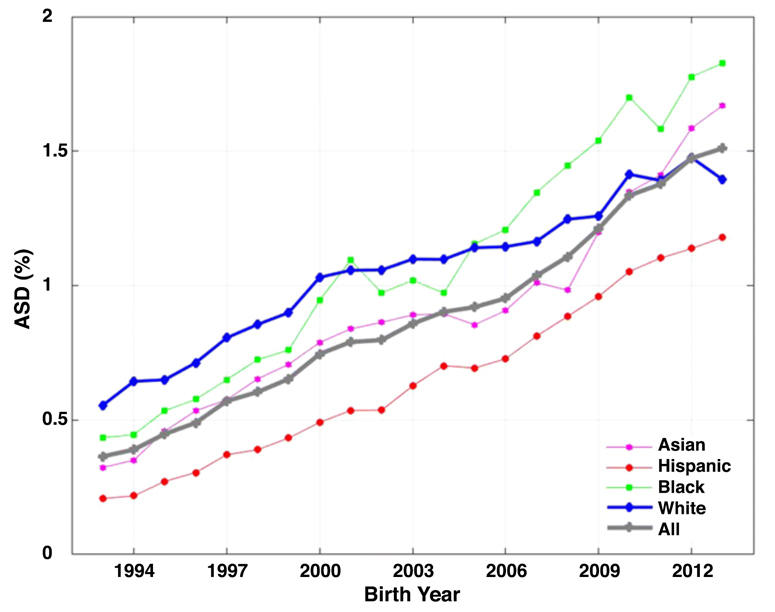
Fig. 1: California – Statewide Autism – By Ethnicity and Birth Year

Researchers Cynthia Nevison, PhD, an atmospheric scientist with the Institute of Arctic and Alpine Research and William Parker, PhD, an immune system and microbiology researcher at Duke University Medical Center, analyzed twenty years’ worth of autism caseload data from the California Department of Developmental Services (DDS). Since 1978, DDS, has been providing services and supports to Californians with developmental disabilities, including autism. Nevison and Parker used DDS data from California’s thirty-six most populous counties and found disparity between autism rates by race and socioeconomics.
Autism is classified as a spectrum disorder, meaning that there is a wide variation of symptoms and severity for individuals. Sadly, the team found that African American, Hispanic and economically disadvantaged children are being diagnosed more often with severe autism than other groups.
Author Nevison states in CU Boulder Today, “While autism was once considered a condition that occurs mainly among whites of high socioeconomic status, these data suggest that the brunt of severe autism is now increasingly being borne by low-income families and ethnic minorities.”
SafeMinds recently spent time with Cynthia Nevison, to discuss her new paper and enquire about the implications of her research.
1. What inspired you to look at socioeconomic levels and race as it relates to Autism Spectrum Disorder (ASD)?
My new paper is a follow-up to a paper I produced with Walter Zahorodny (of Rutgers University in NJ) in 2019 that examined the U.S. Department of Education’s Individuals with Disability Education Act (IDEA) data for 3-5-year-olds. We found the fastest growth in ASD was among blacks and Hispanics with black prevalence overtaking white prevalence in the majority of states by birth year 2009. The IDEA data also suggested a white plateau in ASD between birth years 2004-2007.
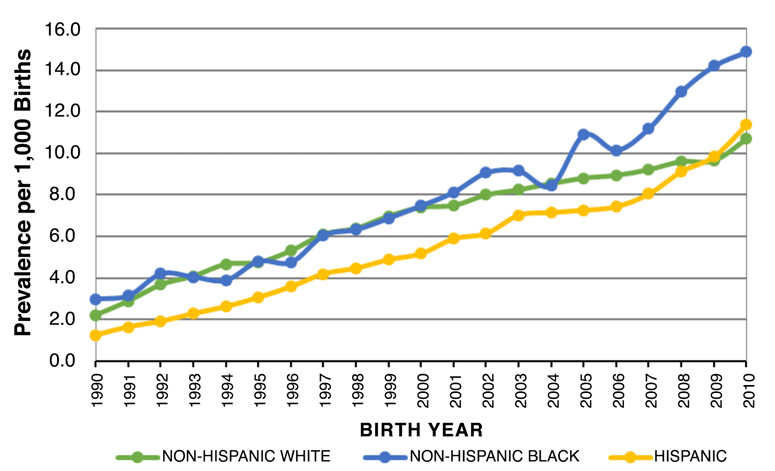
In the 2019 paper, I cited a conference poster by Pearl et al. 2019. (See Fig. 2 below)
Fig. 2: Pearl et al. – California – Autism Prevalence per 1,000 Births – By Ethnicity and Birth Year
Pearl et al. showed, using California DDS data, that the white plateau was happening among privately insured (i.e., wealthier) whites starting around birth year 2000. Prevalence continued to increase through birth year 2010 (the last year of Pearl’s study) among publicly insured (i.e., lower income) whites, as well as among blacks and Hispanics. This suggested a link between ASD and socioeconomics.
While I knew that DDS wouldn’t give me information about the insurance status of their ASD clients (note: Pearl is a California state employee who has privileged access to detailed DDS data), I hypothesized that I could use geography as a proxy for wealth. I submitted a public records act request and acquired my own DDS dataset. For my latest paper with Dr. Parker, that dataset was resolved by county, grade and race, in an effort to understand the apparent recent plateau in white ASD prevalence. The dataset was also used to evaluate whether an increase in ASD was occurring preferentially among specific income groups.
2. What criteria did you use to determine socioeconomic levels of ASD families?
I used median household income by county from U.S. census data as a proxy for socioeconomic levels. It would have been preferable to have specific income data for each ASD case, but that information was not available to me as an outside researcher without privileged access to DDS data. In my paper, I mention this as a limitation of my study, “… this is an ecological, population-based study without access to personally identifying information about each ASD case.”
3. Why did you use California for your research as opposed to other states?
I chose California because DDS has a long-term high-quality dataset for which I knew I could get county, age and race-resolved data. Also, the Pearl et al. 2019 study that helped inspire my study had used California DDS data. Finally, I had county and age-resolved California DDS data from 2014 which had shown weak negative correlations between ASD prevalence and county income. I hypothesized that the correlations would be stronger and more apparent among whites if I could distinguish further by race/ethnicity. For instance, Hispanics, who make up 55% of California’s school population, have had lower ASD rates but are now increasing rapidly. It turned out that I was right.
4. Your paper implies that environmental factors could be influencing the rise of autism rates. Is this an area of research that you hope grows in the near future?
Absolutely. As many people have pointed out for years, the rapid growth in ASD prevalence over the last three decades cannot be caused by genetics alone. That said, I do think that genetic susceptibility is involved in autism risk. However, there is a big difference between having genes that put you at risk for environmental insults that may lead to autism versus having genes that in and of themselves cause autism.
5. Several times in your study, you report that 2000 was a watershed year when the rate of autism in wealthy white families started to plateau and then decline. Did your research point to anything special or unusual that happened in that timeframe?
I did not investigate this in detail and was not involved in autism research at that time. However, I have learned from those who were paying attention back in 2000 that this was a year of growing autism awareness and advocacy among parents, particularly in California.
The California DDS 1999 report had just come out reporting a “dramatic” increase in autism prevalence in the state over the past decade. In addition, Congressman Dan Burton held hearings on autism prevalence increases with an accompanying “Hear their silence” rally of mostly parents in Washington, D.C. As a result of parent actions, the Federal Children’s Health Act of 2000 included centers of excellence for autism research at the NIH and CDC and established an Autism Coordinating Committee, all precursors to the Combating Autism Act of 2006, and more recently the Autism Cares Act.
I should note also that the choice of 2000 as a watershed year was driven by the DDS data themselves. This is the birth year where one can clearly see a changepoint toward flatter growth in white ASD prevalence in statewide DDS data (see my Figure 1 above). Pearl et al.’s 2019 poster also shows birth year 2000 as the onset of the plateau in ASD prevalence among privately insured white children.
6. What was the biggest surprise you found in the data you analyzed?
I was surprised that the inverse correlation with median county wealth was so striking among whites and also Asians in California. I was particularly struck by the results in Santa Clara County (a.k.a. the Silicon Valley). This county has a larger population than Marin or San Mateo (which are other counties where the DDS data show that the ASD trend is actually decreasing among whites) and thus I had high confidence that the declining trend in Santa Clara was a robust result.
In fact, it was the Silicon Valley that first piqued my interest in autism back in 2006/2007. I was expecting my first son and had read in the newspaper that a boy in the United States had a 1 in 91 chance of being diagnosed with an autism spectrum disorder. A good friend of mine was a special education teacher who regularly attended national meetings to keep up with the latest research. I asked her opinion about this rise in autism among boys and what I could do to protect my son. She told me she’d seen a definite increase in the number of autistic kids over the course of her career and that the leading theory was that there was an upsurge of nerdy men who were marrying nerdy women and fathering genetically autistic children. She pointed to the high autism rates in the Silicon Valley as evidence. That stuck with me as an odd explanation.
By 2010, about a year after the birth of my second son, I began my volunteer work as an autism trends researcher. At that point I realized the need for systematic documentation and quantification of ASD trends. This was within my skill set to do, since I routinely analyze and visualize time trends in greenhouse gases in my work as a climate scientist.
7. Your study is very innovative. It points to possible tactics to employ that could lessen the risk of autism for children of all races and socioeconomic levels. Is there anything you would like to add about your paper?
A pregnant woman today faces odds of about 1 in 20 to 1 in 25 that her son will be diagnosed with ASD, depending on whether you use National Health Interview Survey (NHIS) or Autism and Developmental Disabilities Monitoring (ADDM) data. An African American woman expecting a baby boy likely faces even worse odds. Yet our public health agencies are offering pregnant women essentially zero guidance on prevention. Some are still even insinuating that there is no true increase in autism. In 2018, I heard Colorado Department of Public Health and Environment officials do exactly that at a hearing at the Colorado State House.
Our public health agencies have abdicated responsibility on this issue, even as approximately 100,000 American children per year are being diagnosed with autism. New economic analyses are suggesting that ASD will cost the U.S. $7 to $15 trillion dollars. What my new paper suggests is that parents (usually mothers, who make decisions regarding their children’s health) are stepping into this void of guidance and leadership that our public health agencies are, for whatever reason, not providing. These parents, armed with wealth, resources, education and access to information, appear to be succeeding in lowering their children’s risk for severe autism. This is a result that our political leaders should take seriously, especially in view of the troubling disparities among races and across income lines indicated by the DDS data. Ultimately mothers know better than bureaucrats what is best for their own children.
References
Cynthia Nevison, William Parker. California Autism Prevalence by County and Race/Ethnicity: Declining Trends Among Wealthy Whites. Journal of Autism and Developmental Disorders. March 19, 2020.
State of California. Department of Developmental Services.
ARCA. History of Developmental Disabilities Service Delivery System in California.
Lisa Marshall. Autism Rates Declining Among Wealthy Whites, Escalating Among Poor. CU Boulder Today. March 19, 2020 https://www.colorado.edu/today/2020/03/19/autism-rates-declining-among-wealthy-whites-escalating-among-poor
Cynthia Nevison, Walter Zahorodny. Race/Ethnicity-Resolved Time Trends in United States ASD Prevalence Estimates from IDEA and ADDM. Journal of Autism and Developmental Disorders. August 21, 2019.
M. Pearl, S. Matias, V. Poon and G. C. Windham. Trends is Birth Prevalence of Autism Spectrum Disorder (ASD) in California from 1990 to 2010, By Race-Ethnicity and Income. International Society for Autism Research.
House Hearing. 106 Congress. Committee of Government Reform. Autism: Present Challenges, Future Needs—Why the Increased Rates? April 6, 2000.
David Brown. Autism’s New Face. Washington Post. March 26, 2000.
Janet Cakir, Richard E. Frye, Stephen J. Walker. The Lifetime Social Cost of Autism 1990-2029. Research in Autism Spectrum Disorders. Volume 72. April 2020.


